Running SCORPIUS on a SingleCellExperiment object
Robrecht Cannoodt
2019-01-12
Source:vignettes/singlecellexperiment.Rmd
singlecellexperiment.RmdThis vignette assumes that you have a SingleCellExperiment object at
the ready. As an example, we create one from the ginhoux
dataset containing 248 dendritic cell progenitors.
library(SCORPIUS)
library(SingleCellExperiment)

data(ginhoux)

sce <- SingleCellExperiment(
  assays = list(counts = t(ginhoux$expression)),
  colData = ginhoux$sample_info
)

# short hand notation
group_name <- colData(sce)$group_name

sce
## class: SingleCellExperiment
## dim: 2000 245
## metadata(0):
## assays(1): counts
## rownames(2000): Mpo DQ688647 ... Clcf1 Pip5k1c
## rowData names(0):
## colnames(245): SRR1558744 SRR1558745 ... SRR1558993 SRR1558994
## colData names(1): group_name
## reducedDimNames(0):
## mainExpName: NULL
## altExpNames(0):Reduce dimensionality of the dataset
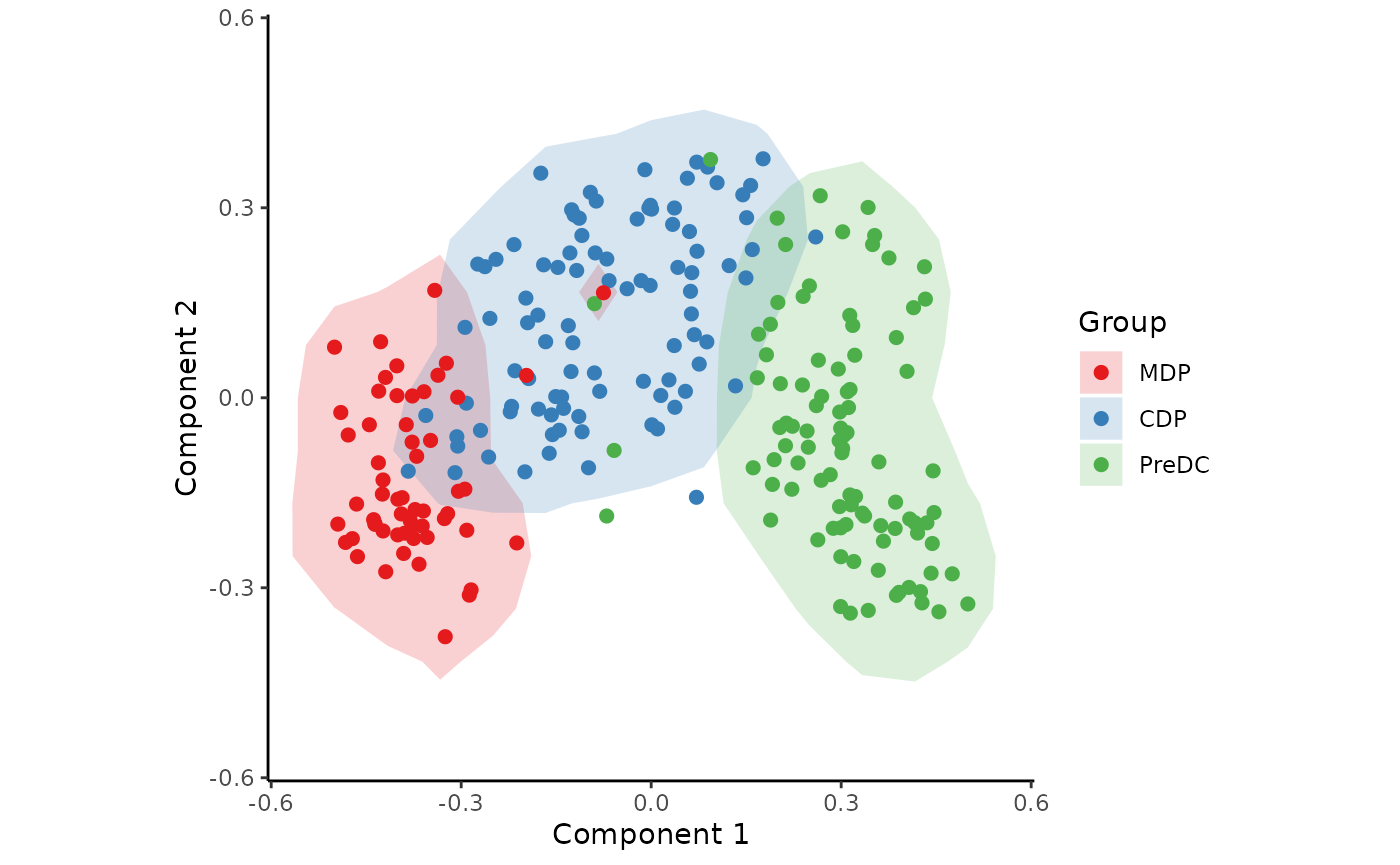
space <- reduce_dimensionality(t(assay(sce, "counts")), dist = "spearman", ndim = 3)The new space is a matrix that can be visualised with or without colouring of the different cell types.
draw_trajectory_plot(
  space,
  progression_group = group_name,
  contour = TRUE
)
## Warning: `aes_string()` was deprecated in ggplot2 3.0.0.
## ℹ Please use tidy evaluation idioms with `aes()`.
## ℹ See also `vignette("ggplot2-in-packages")` for more information.
## ℹ The deprecated feature was likely used in the SCORPIUS package.
## Please report the issue at <https://github.com/rcannood/SCORPIUS/issues>.
## This warning is displayed once every 8 hours.
## Call `lifecycle::last_lifecycle_warnings()` to see where this warning was
## generated.
Inferring a trajectory through the cells
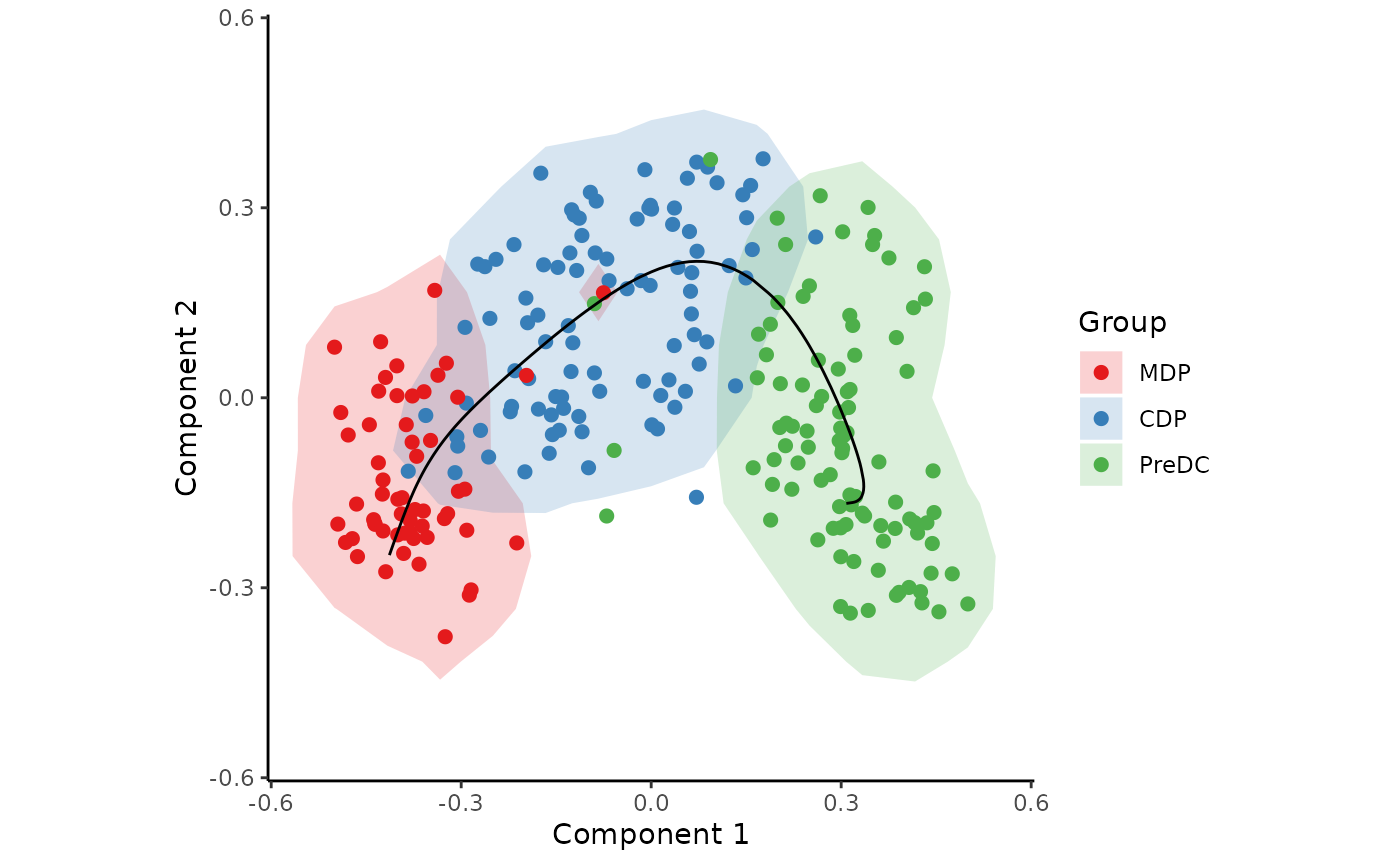
traj <- infer_trajectory(space)The result is a list containing the final trajectory
path and the inferred timeline for each sample
time.
draw_trajectory_plot(
  space,
  progression_group = group_name,
  path = traj$path,
  contour = TRUE
)
## Warning: Using `size` aesthetic for lines was deprecated in ggplot2 3.4.0.
## ℹ Please use `linewidth` instead.
## ℹ The deprecated feature was likely used in the SCORPIUS package.
## Please report the issue at <https://github.com/rcannood/SCORPIUS/issues>.
## This warning is displayed once every 8 hours.
## Call `lifecycle::last_lifecycle_warnings()` to see where this warning was
## generated.
Finding candidate marker genes
gimp <- gene_importances(
  t(assay(sce, "counts")),
  traj$time,
  num_permutations = 0,
  num_threads = 8
)
gene_sel <- gimp[1:50,]
expr_sel <- t(assay(sce, "counts"))[,gene_sel$gene]
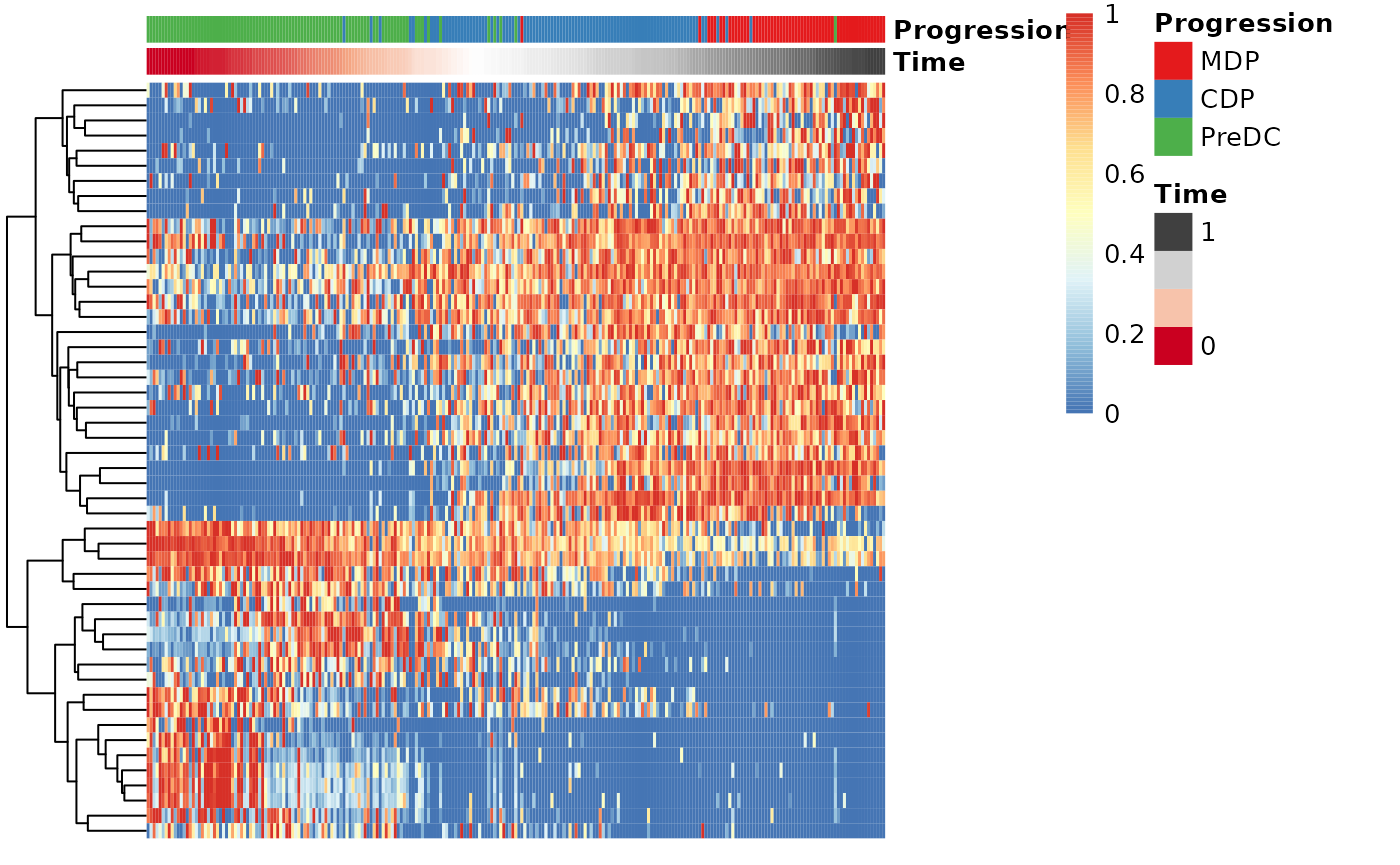
To visualise the expression of the selected genes, use the
draw_trajectory_heatmap function.
draw_trajectory_heatmap(expr_sel, traj$time, group_name)
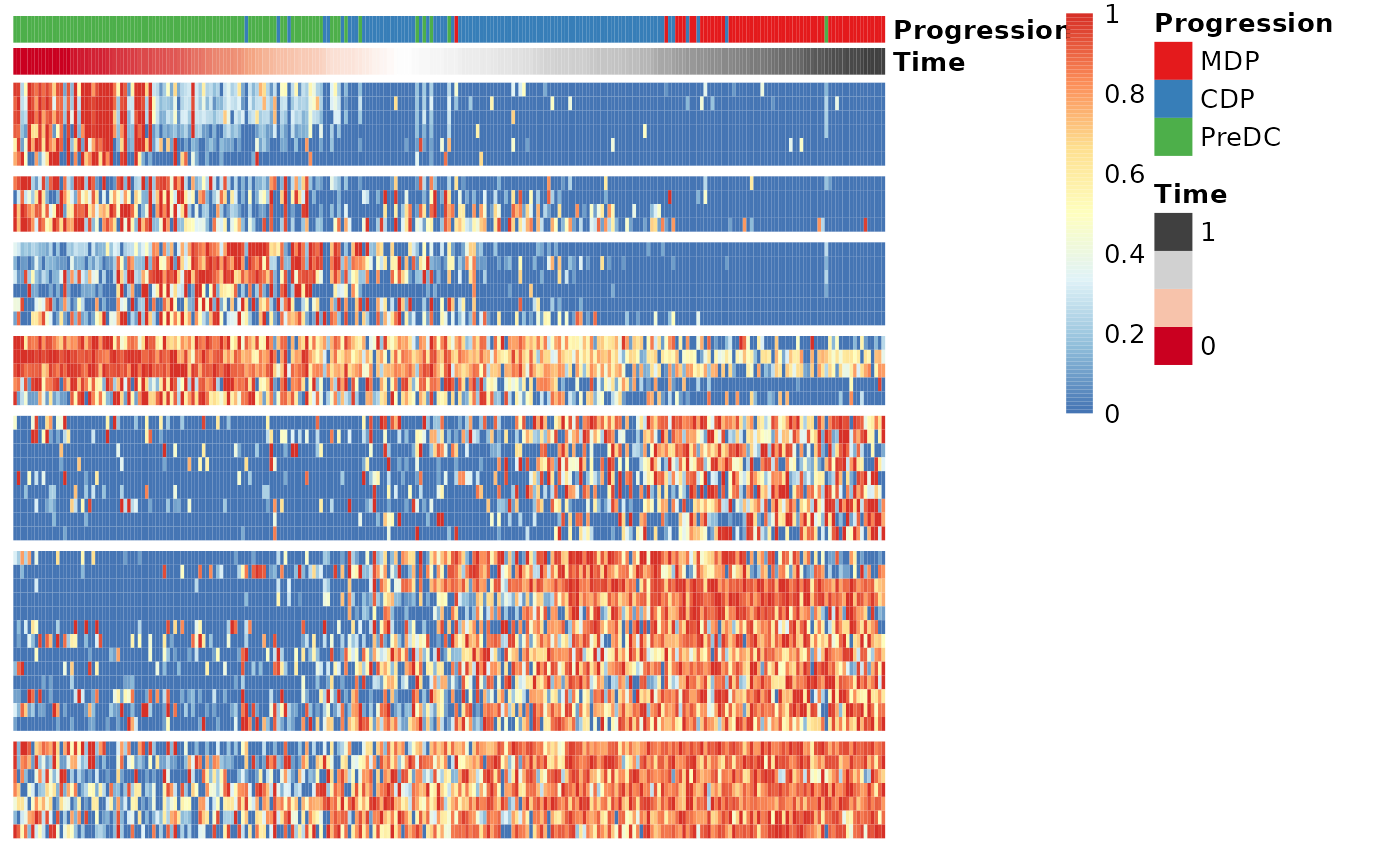
Finally, these genes can also be grouped into modules as follows:
modules <- extract_modules(scale_quantile(expr_sel), traj$time, verbose = FALSE)
draw_trajectory_heatmap(expr_sel, traj$time, group_name, modules)
Store outputs in SingleCellExperiment
reducedDims(sce) <- SimpleList(MDS = space)
colData(sce)$trajectory_path <- traj$path
colData(sce)$trajectory_pseudotime <- traj$time
rowData(sce)$trajectory_importance <- gimp[match(rownames(sce), gimp$gene),]$importance

sce
## class: SingleCellExperiment
## dim: 2000 245
## metadata(0):
## assays(1): counts
## rownames(2000): Mpo DQ688647 ... Clcf1 Pip5k1c
## rowData names(1): trajectory_importance
## colnames(245): SRR1558744 SRR1558745 ... SRR1558993 SRR1558994
## colData names(3): group_name trajectory_path trajectory_pseudotime
## reducedDimNames(1): MDS
## mainExpName: NULL
## altExpNames(0):