reduce_dimensionality performs an eigenanalysis of the given dissimilarity matrix
and returns coordinates of the samples represented in an ndim-dimensional space.
Usage
reduce_dimensionality(
  x,
  dist = c("spearman", "pearson", "euclidean", "cosine", "manhattan"),
  ndim = 3,
  num_landmarks = 1000
)
Arguments
- x
a numeric matrix
- dist
the distance metric to be used; can be any of the metrics listed in
dynutils::calculate_distance().- ndim
the maximum dimension of the space which the data are to be represented in; must be in \([1, n - 1]\), with \(n\) the number of samples (rows) in
x.- num_landmarks
the number of landmarks to be selected.
Examples
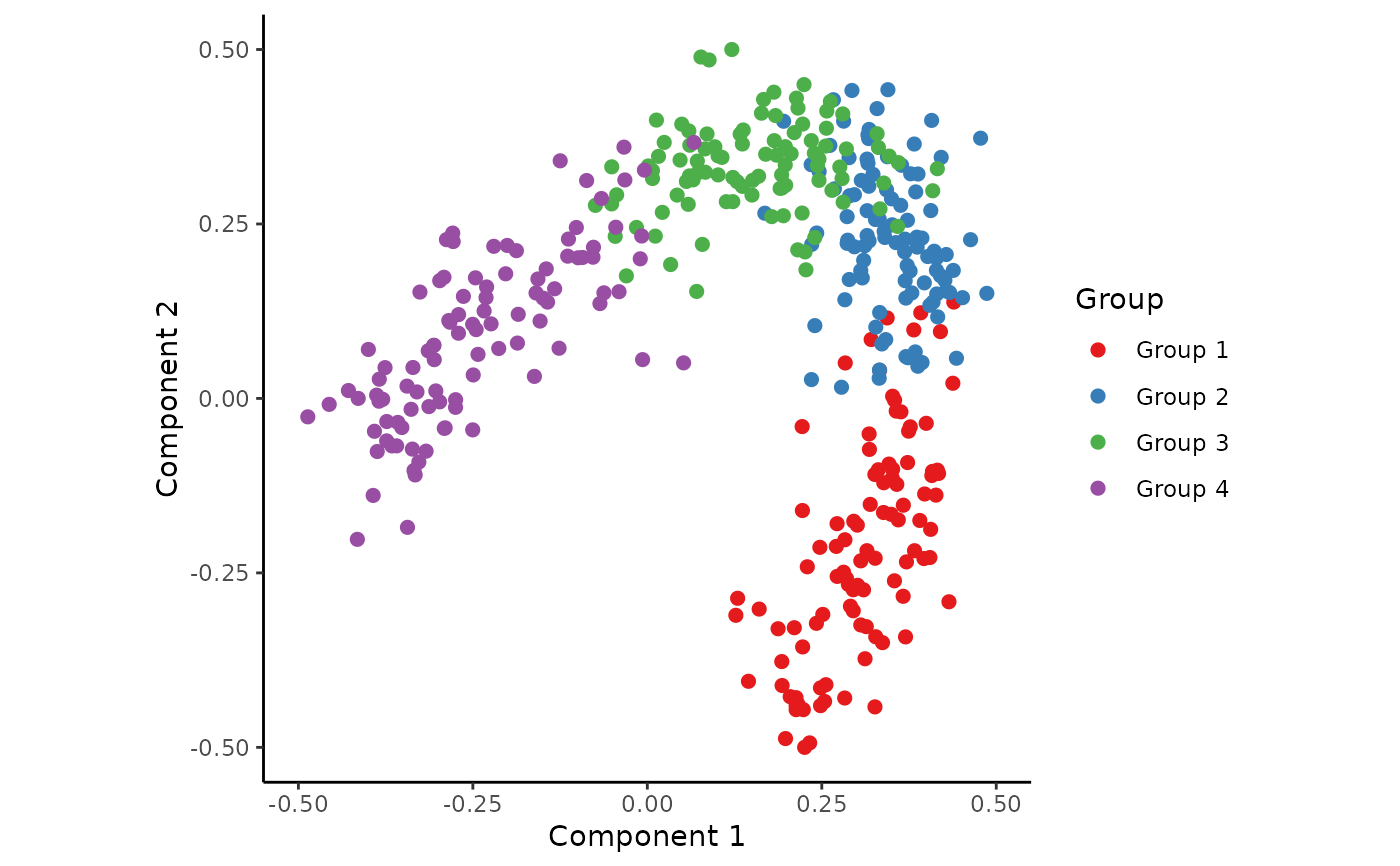
## Generate an example dataset
dataset <- generate_dataset(num_genes = 200, num_samples = 400, num_groups = 4)

## Reduce the dimensionality of this dataset
space <- reduce_dimensionality(dataset$expression, ndim = 2)

## Visualise the dataset
draw_trajectory_plot(space, progression_group = dataset$sample_info$group_name)
#> Ignoring unknown labels:
#> • fill : "Group"